
Energy Consumption and Emissions
Emissions from combusting marine fossil fuels in internal combustion engines in 2019 amounted to 1,995,763 tCO2 representing 99.51% of our Scope 1 emissions (Marine Fuel, LO, escape / use of refrigerants, and use of petrol and diesel in company vehicles).
Scope 1 plus Scope 2 (from use of commercial electrical power in our shore offices) gave a total of 2,006,038 tCO2 emissions from CNCo's operations.
Scope 2 emissions are immaterial in relation to our Scope 1 emissions (0.018%) and contributed 366.92 tCO2 to the figure above.
Scope 3 emissions from shore management and seagoing employees air travel contributed 5,752 tCO2 which is a low contributor (0.286%) to total GHG footprint.
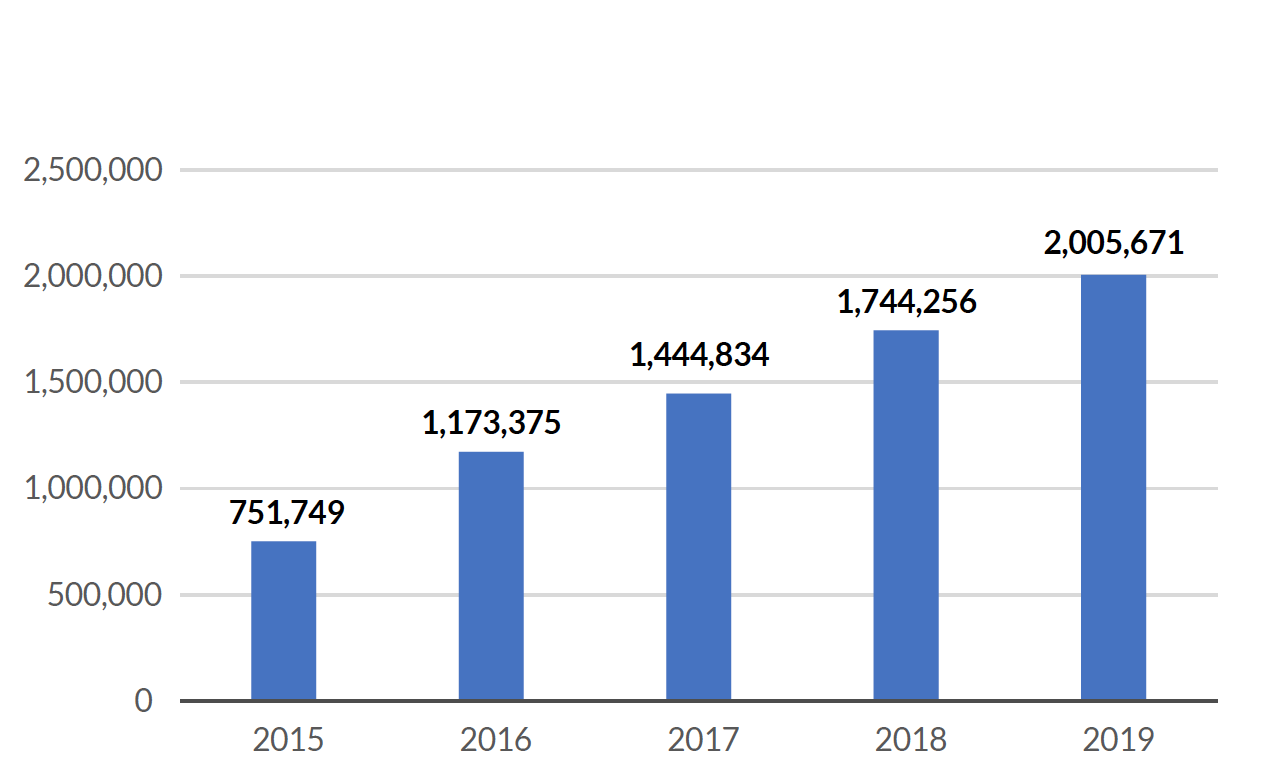

The overall emissions figure for Scope 1 increased by 14.99% on the prior year due directly to the increase in fleet size and distance travelled.
The total number of Swire Bulk vessels increased by 43% y-o-y. Those are mainly vessels on short- and long-term charters. This translated to the increase in total distance travelled by 35% and 18% increase in total vessel days when compared to 2018 figures. For Swire Shipping's fleet, we saw an increase in total distance travelled by 5% over the 2019 calendar year with 0.8% increase in total vessel days.
A summary of all these figures together with the trend over the years is presented in the Environmental Summary report.
The normalised figures are shown in EEOI graphs of emissions per tonne / mile (average per vessel in fleet).
Scope 1 emissions include all vessels categorised as follows:
Normalised Scope 1 emissions show a drop from the 2016 level to being relatively stable over the past three years with a slight 1 - 2% fluctuation.
We continue to measure emissions of SOx, NOx, Particulate Matter (PM) and Volatile Organic Compounds (VOCs). As they are directly related to Scope 1 emissions, their numbers have been fluctuating accordingly with an average of 14% increase on 2018 figures.
Global Sulphur Limit on Marine Fuels